Metrics using Gnocchi
- Feb. 15, 2018 by
- Joon Yee Chuah
Gnocchi is OpenStack's "Metrics-as-a-Service" component. Gnocchi is currently available on Chameleon resources at the University of Chicago, and will be online soon at Texas Advanced Computing Center. Chameleon images (CC-CentOS7 and CC-Ubuntu) are already configured to send metrics to Gnocchi. Gnocchi is the service which aggregates metrics that are sent to it from Chameleon instances that are running the collectd service. We can access Gnocchi and retrieve metrics through a command line client or programmatically.
Configuring Your Instance
Conveniently, there is not much to configure after you launch an instance. If you are using CC-CentOS7 or CC-Ubuntu-16.04, everything works "out of the box." Let's say that we've launched a CC-CentOS7. On the instance details page in the GUI, it lists the instance's UUID.
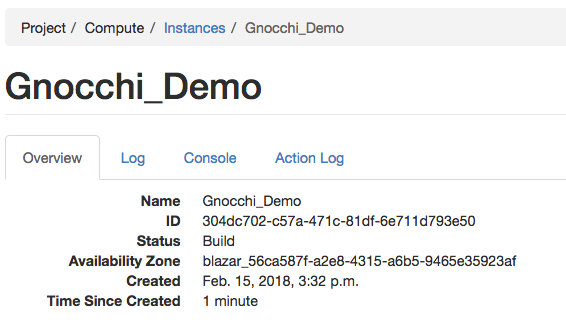
In this case, my instance's UUID is 304dc702-c57a-471c-81df-6e711d793e50. This UUID will be used to identify the instance within Gnocchi. Write this down for later!
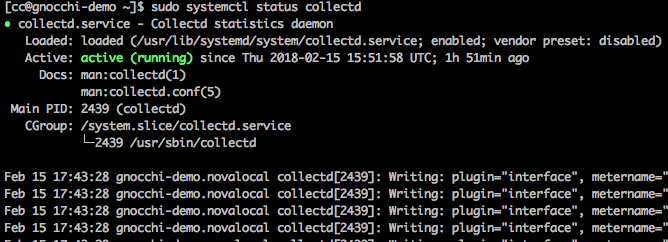
The CC-CentOS7 appliance comes with the collectd service installed. collectd is preconfigured to collect metrics from the system and send them to the Gnocchi. I can see that it is running by typing sudo systemctl status collectd at the prompt. This is the response:
By default, CC-CentOS7 reports minimal metrics such as network usage. You may load additional plugins by editing /etc/collectd.conf and uncommenting any of the LoadPlugin lines.
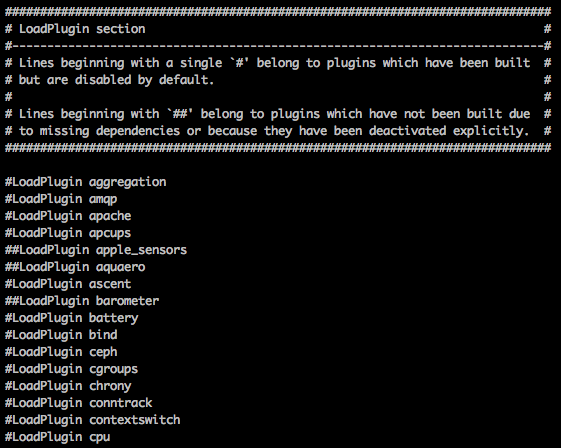
After editing the configuration file, you can restart the service with sudo systemctl restart collectd
The OpenStack Client
Your metrics are stored and aggregated on Chameleon. Aggregation does not occur in real time, so it may take a while for the latest metrics to become available. However, all metrics are stored as they are reported so don't worry about losing measurements. To access the metrics from your local machine, first we need to install the OpenStack client using Python Pip. You can do this with pip install python-openstackclient.
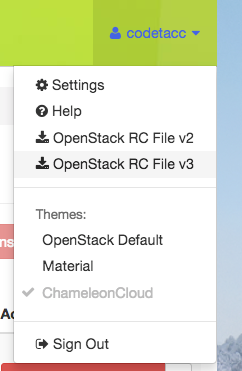
To access your Project using the OpenStack CLI, we need to configure environment variables that allow us to access our project. If you are using macOS or a Linux based shell (or the Ubuntu shell in Windows 10) you can download your Project's OpenStack RC file. From within the GUI, click on the dropdown with your username in the upper right corner and click the OpenStack RC File v3 link.
This will download a file with your project name on it. In my case, my filename was CH-819507-openrc.sh. Now we can run it using source CH-819507-openrc.sh. You will be prompted to enter in your Chameleon password. Now you can open the OpenStack client by typing openstack into your terminal.
Retrieving Metrics
Each instance that you launch is a resource in the OpenStack client. If you want to view a list of resources, you can type metric resource list. You will be presented with a table that lists resource UUIDs. Since we have the UUID of the instance, we can jump straight to a list of metrics collected from the instance by typing metric resource show <uuid>.
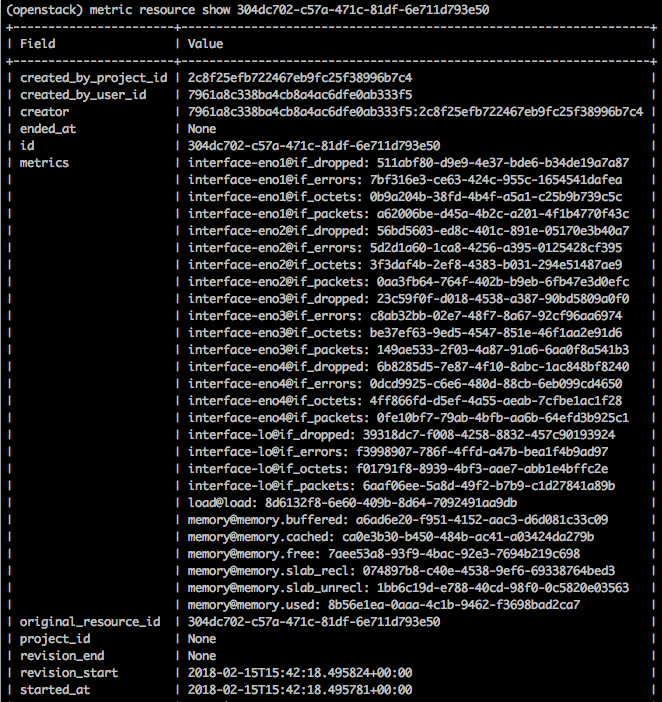
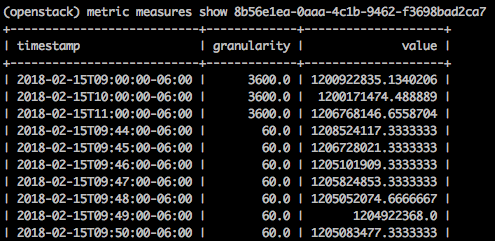
Each metric has a name and UUID. You can display the individual metric timestamps and values by typing in metric measures show <uuid> where <uuid> is the UUID of the metric. (Not the resource!)
Summary
This is a simple introduction to Gnocchi's capabilities. Gnocchi also has an associated Python package for accessing and storing metrics. You can view Gnocchi's documentation for more details.
No comments